Maryland's Economic Competitiveness
Insights into Maryland's economy that allow us to better understand our strengths and opportunities
Gain valuable insights into Maryland's economic landscape through our comprehensive data-driven analyses. See where Maryland stands when it comes to key areas like population change, employment growth, wages, taxation and more. Explore our snapshots for more information on the topic at hand, the data and what it reveals.
2023 Data Snapshots
The information provided below is based on data from our 2023 Competitiveness Redbook. Please check back soon for an updated analysis of our 2024 data.
What the data is telling us:
- Poor economic, regulatory and cost of business rankings indicate that Maryland has an unfavorable environment for business growth, retention and sustainability. Businesses are what drive our economy and what help communities thrive. We must advocate for and create a more favorable environment that attracts businesses and helps them be successful.
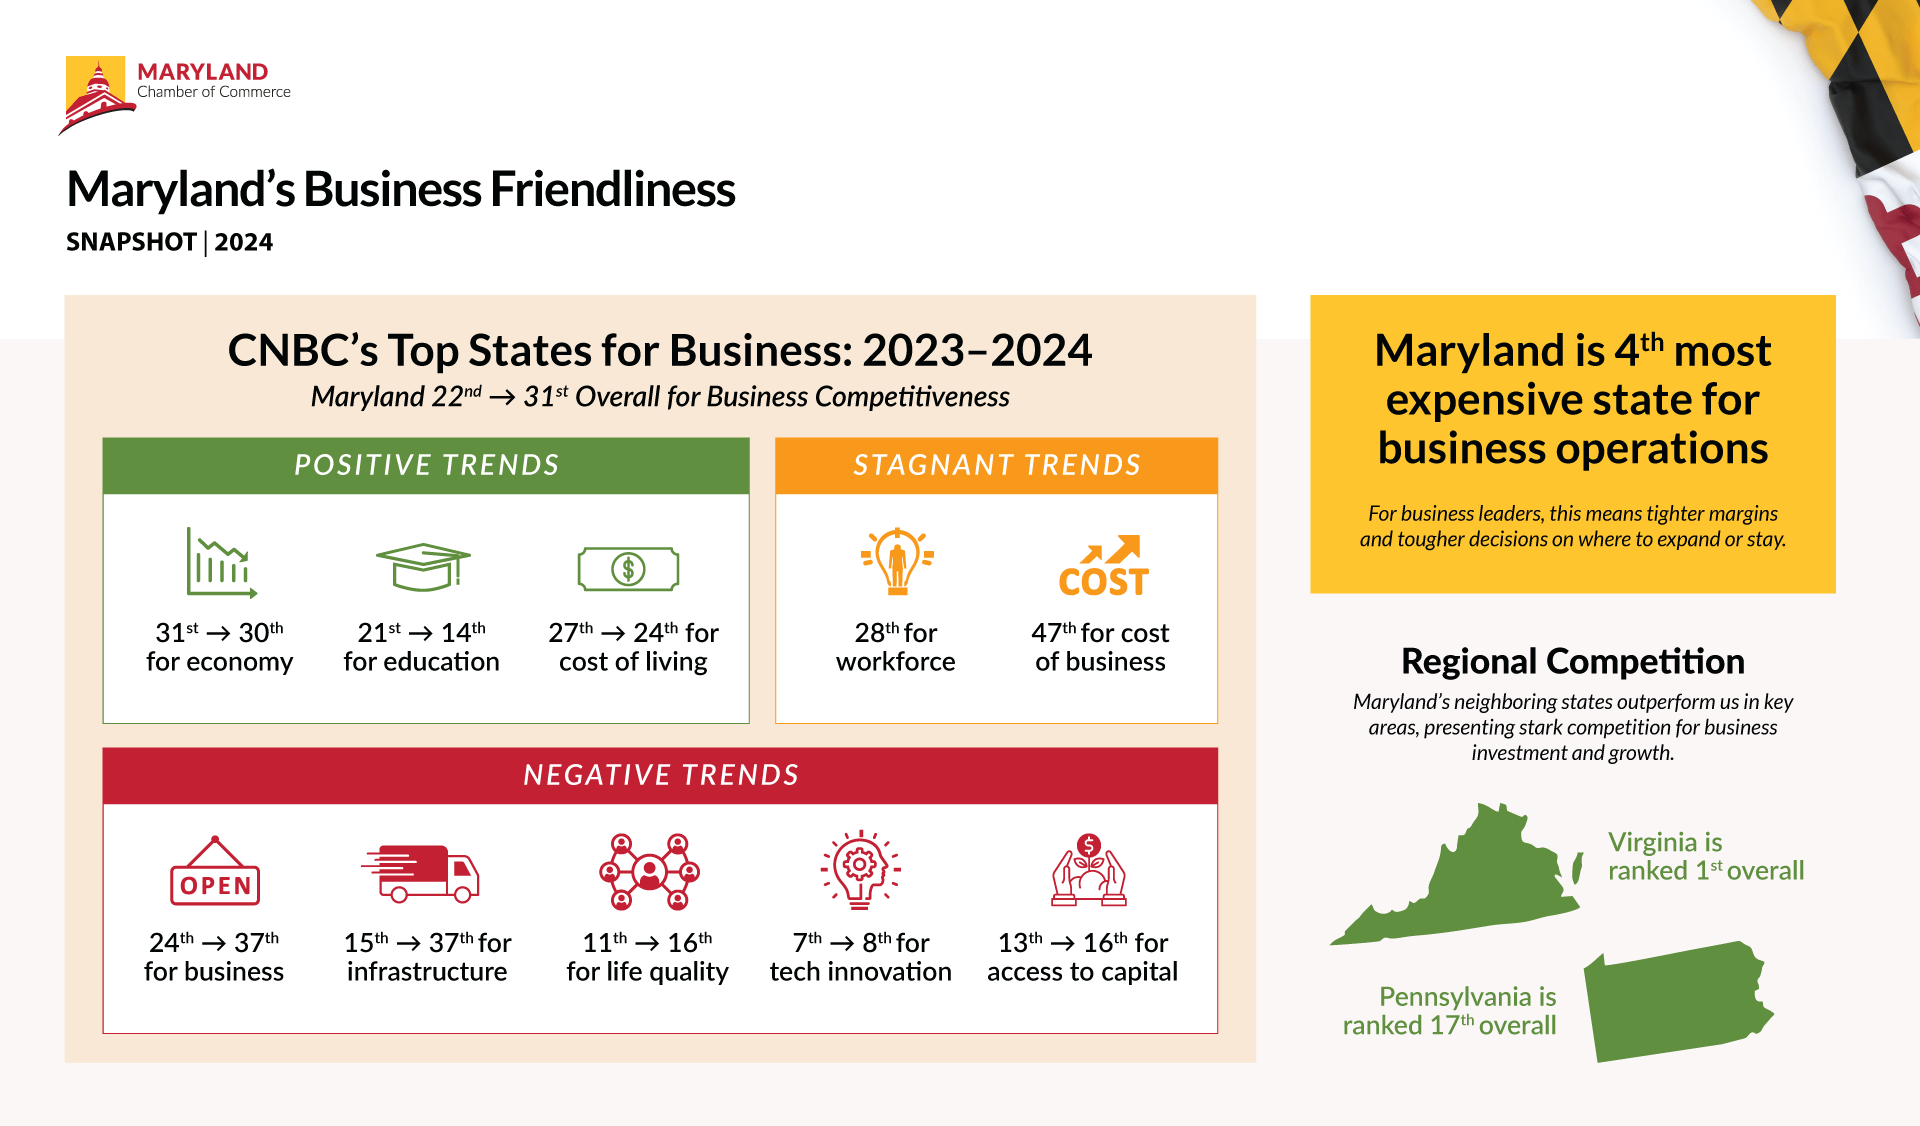
- Maryland ranked 27th overall in CNBC’s Top States for Business. While the state ranked fairly well for access to capital, tech & innovation, and quality of life, Maryland was ranked poorly for business friendliness (29th), economy (32nd), cost of doing business (44th) and cost of living (44th).
The information provided below is based on data from our 2023 Competitiveness Redbook. Please check back soon for an updated analysis of our 2024 data.
What the data is telling us:
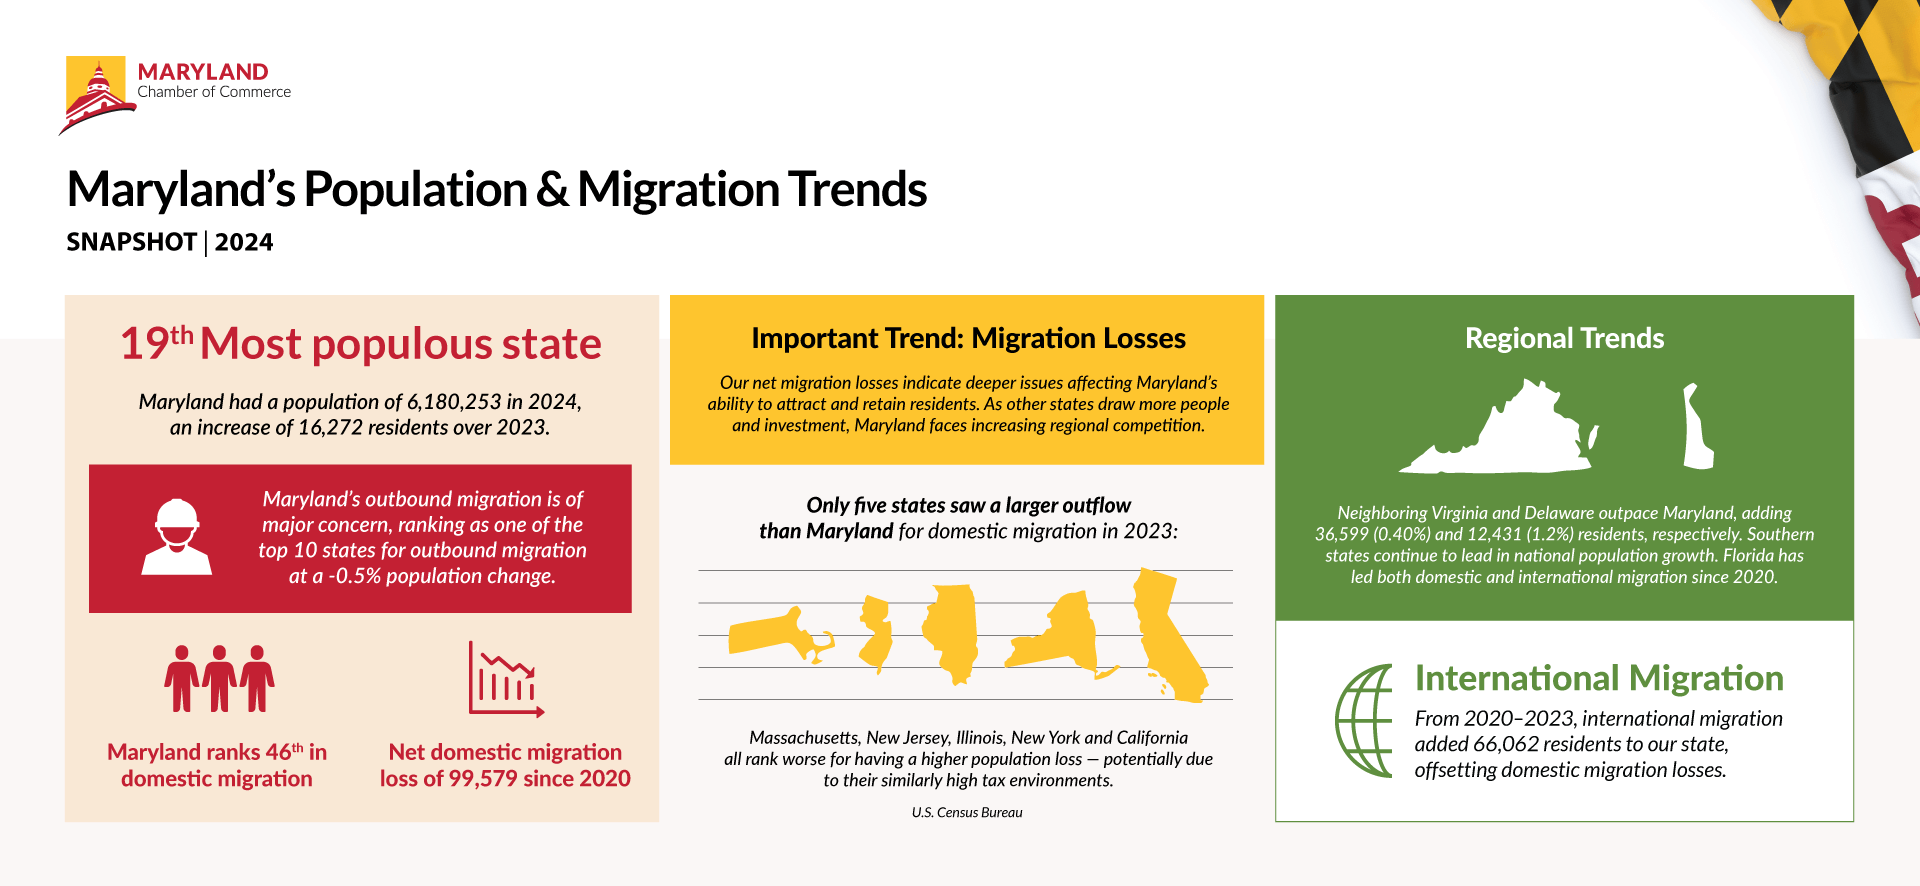
- Population Trends: Maryland is ranked as the 19th most populous state, but ranks 40th for population growth, with a population loss of -0.12%. Compounding this negative growth, Maryland’s estimated net domestic migration was also negative, ranking the state 44th in this area.
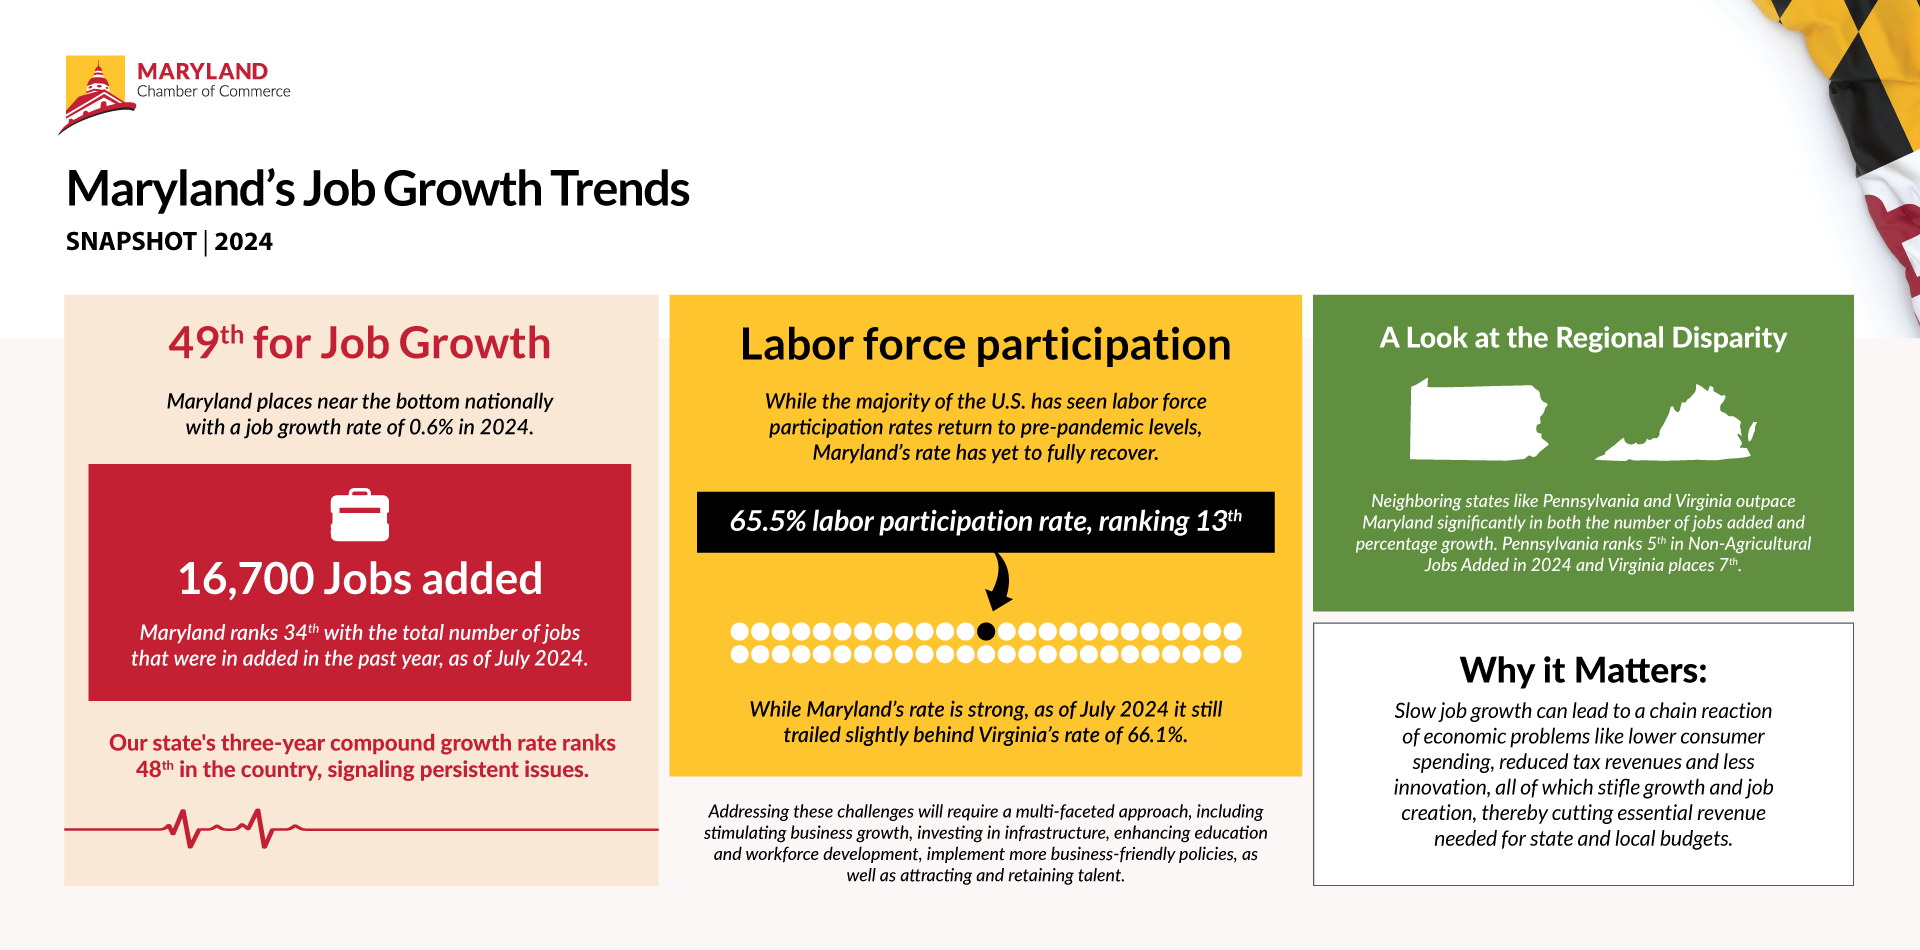
- Why it matters: Slow job growth is an important trend to watch, as it can cause reduced consumer spending, reduced tax revenue, increased unemployment, reduced productivity, and reduced innovation, which can all create barriers to overall economic growth.
The information provided below is based on data from our 2023 Competitiveness Redbook. Please check back soon for an updated analysis of our 2024 data.
What the data is telling us:
- Maryland ranks as having the second highest amount of state and local individual income tax collections per capita. In Fiscal Year 2020, Maryland collected $2,759 in state and local individual income taxes per capita. The only areas ranking higher in this metric are Washington, D.C. and New York. 40.5% of Maryland’s State & Local Tax Collections come from Individual Income Taxes — this is the highest percentage in the country. (Tax Foundation Facts & Figures, 2023)
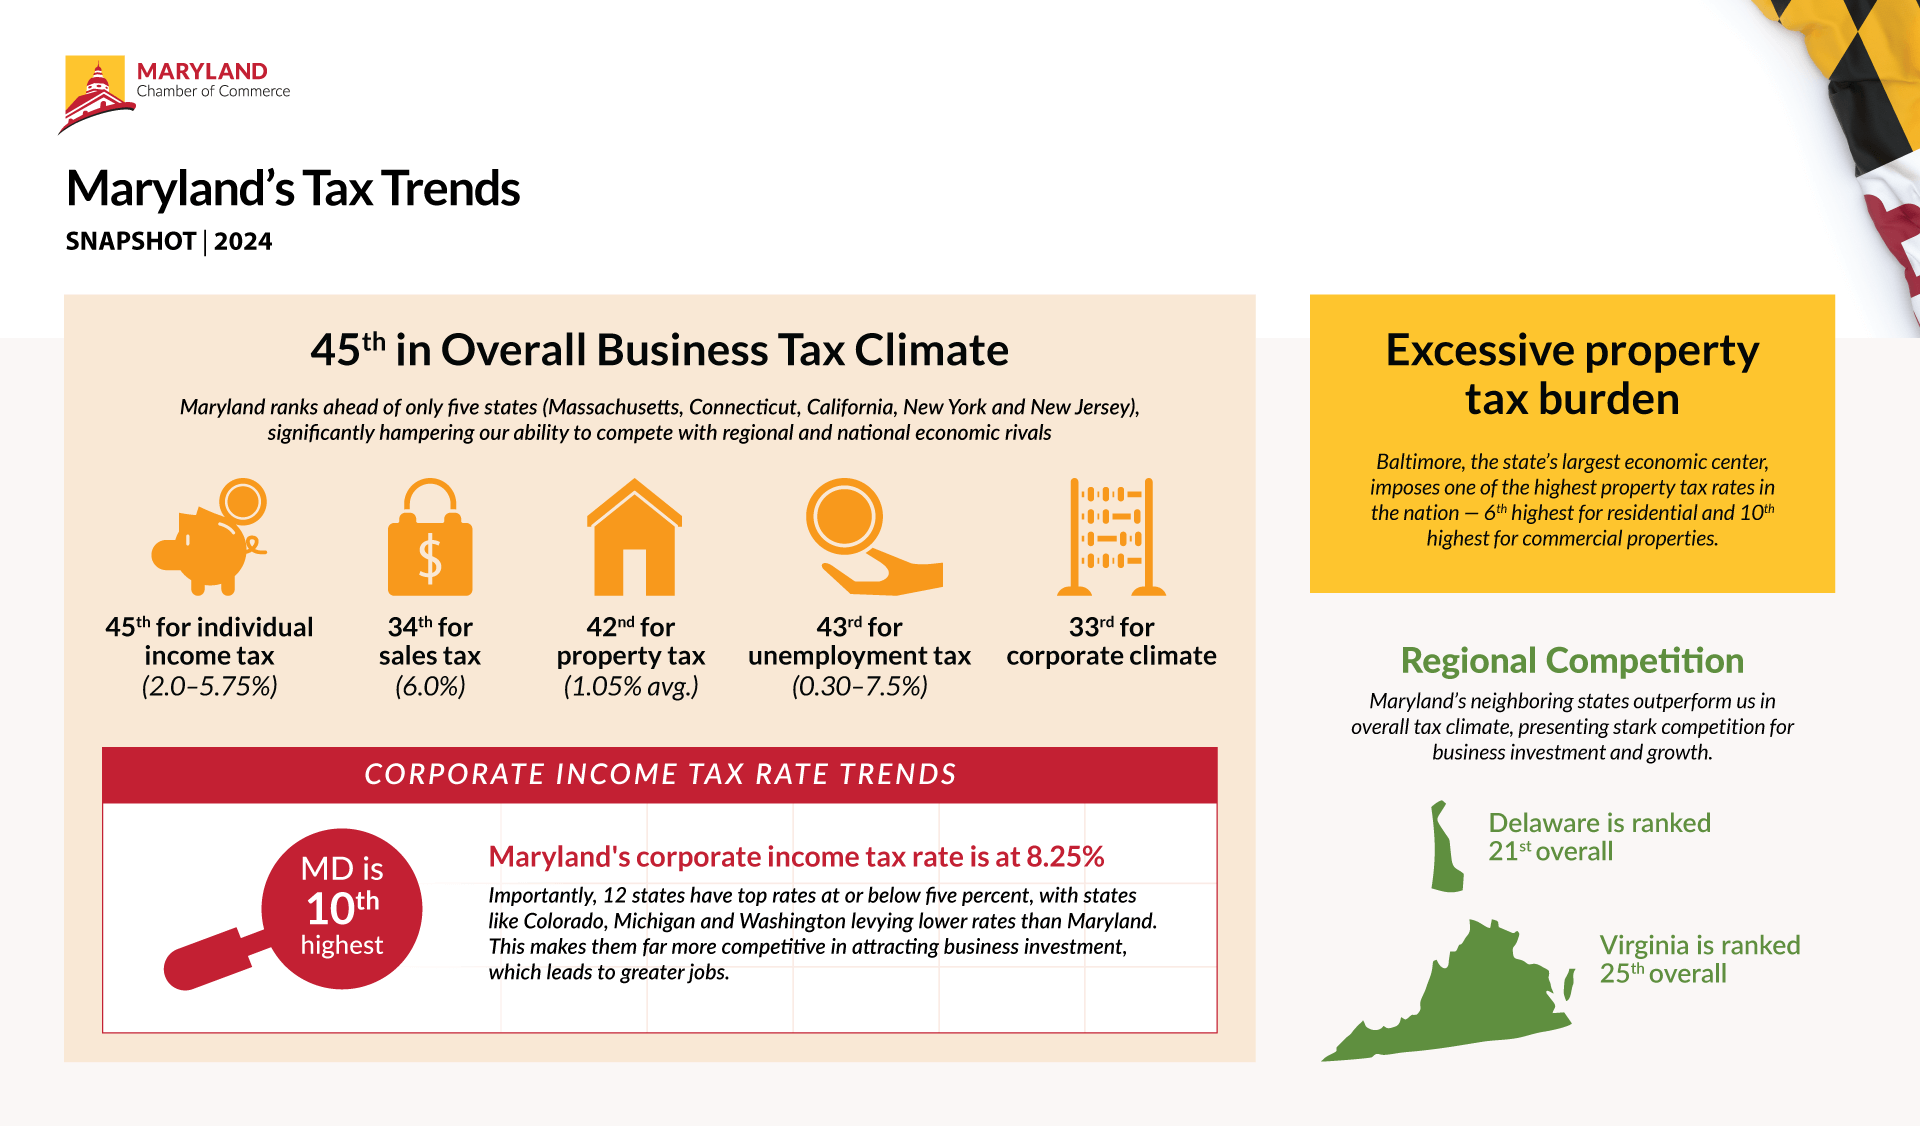
- According to the Tax Foundation’s 2023 Fact & Figures report, Maryland ranks 46th in Overall Business Tax Climate. Maryland scored in the lower half in all metrics including Corporate Tax (33rd), Ind. Income Tax (45th), Sales Tax (30th), Unemployment Ins. Tax (41st), and Property Tax (42nd)
The information provided below is based on data from our 2023 Competitiveness Redbook. Please check back soon for an updated analysis of our 2024 data.
What the data is telling us:
- When compared to neighboring states, Maryland’s minimum wage is higher than Pennsylvania’s ($7.25) and West Virginia’s ($8.75). Maryland’s minimum wage is also higher than Delaware and Virginia’s minimum wages of $11.75 and $12.00, respectively, while New Jersey and New York have slightly higher minimum wages than Maryland, with wages of $14.13 and $14.20, respectively.
- The states with the highest minimum wage rates in the country are Washington state ($15.74), California ($15.50) and Massachusetts ($15); Maryland’s 2024 minimum wage increase will place the state in the top tier for highest minimum wage rates paid in the country.
The information provided below is based on data from our 2023 Competitiveness Redbook. Please check back soon for an updated analysis of our 2024 data.
What the data is telling us:
- Maryland’s housing market has trailed behind many other states in terms of appreciation rates over the past 25 years, ranking 25th with an average increase of 4.7%. The state also ranks low for 5-year and 1-year annualized housing appreciation, coming in at 41st and 48th, respectively. Thus, while the state’s housing market has experienced overall appreciation in the long term, it has suffered from weaker performance in recent years.
- While Maryland has a high homeownership rate of 72.9% (ranked 11th in the nation in 2022) and has experienced a 6.4% increase in homeownership from 2017 to 2022 (ranked 4th nationally for this increase), the low appreciation rates suggest a challenging economic environment for Maryland’s housing market.
The information provided below is based on data from our 2023 Competitiveness Redbook. Please check back soon for an updated analysis of our 2024 data.
What the data is telling us:
- While the state currently boasts a highly educated and skilled workforce, businesses in Maryland have difficulties finding qualified, skilled workers to fill available jobs. Unfortunately, data regarding Maryland’s educational spending, assessment and ability to attract college-bound students paints an even more challenging environment ahead. Despite significant investments in education, Maryland’s educational assessment scores are ranked as some of the worst in the nation, and the state’s educational and business landscape is not competitive enough to be attractive to college-bound students.
- These indicators highlight the need for collaborative efforts between policymakers and educational leaders to identify strategies that improve the efficiency and quality of Maryland’s education system. By doing so, Maryland can enhance opportunities for its students and foster a skilled, highly competitive workforce that will attract businesses and drive economic growth.
The information provided below is based on data from our 2023 Competitiveness Redbook. Please check back soon for an updated analysis of our 2024 data.
What the data is telling us:
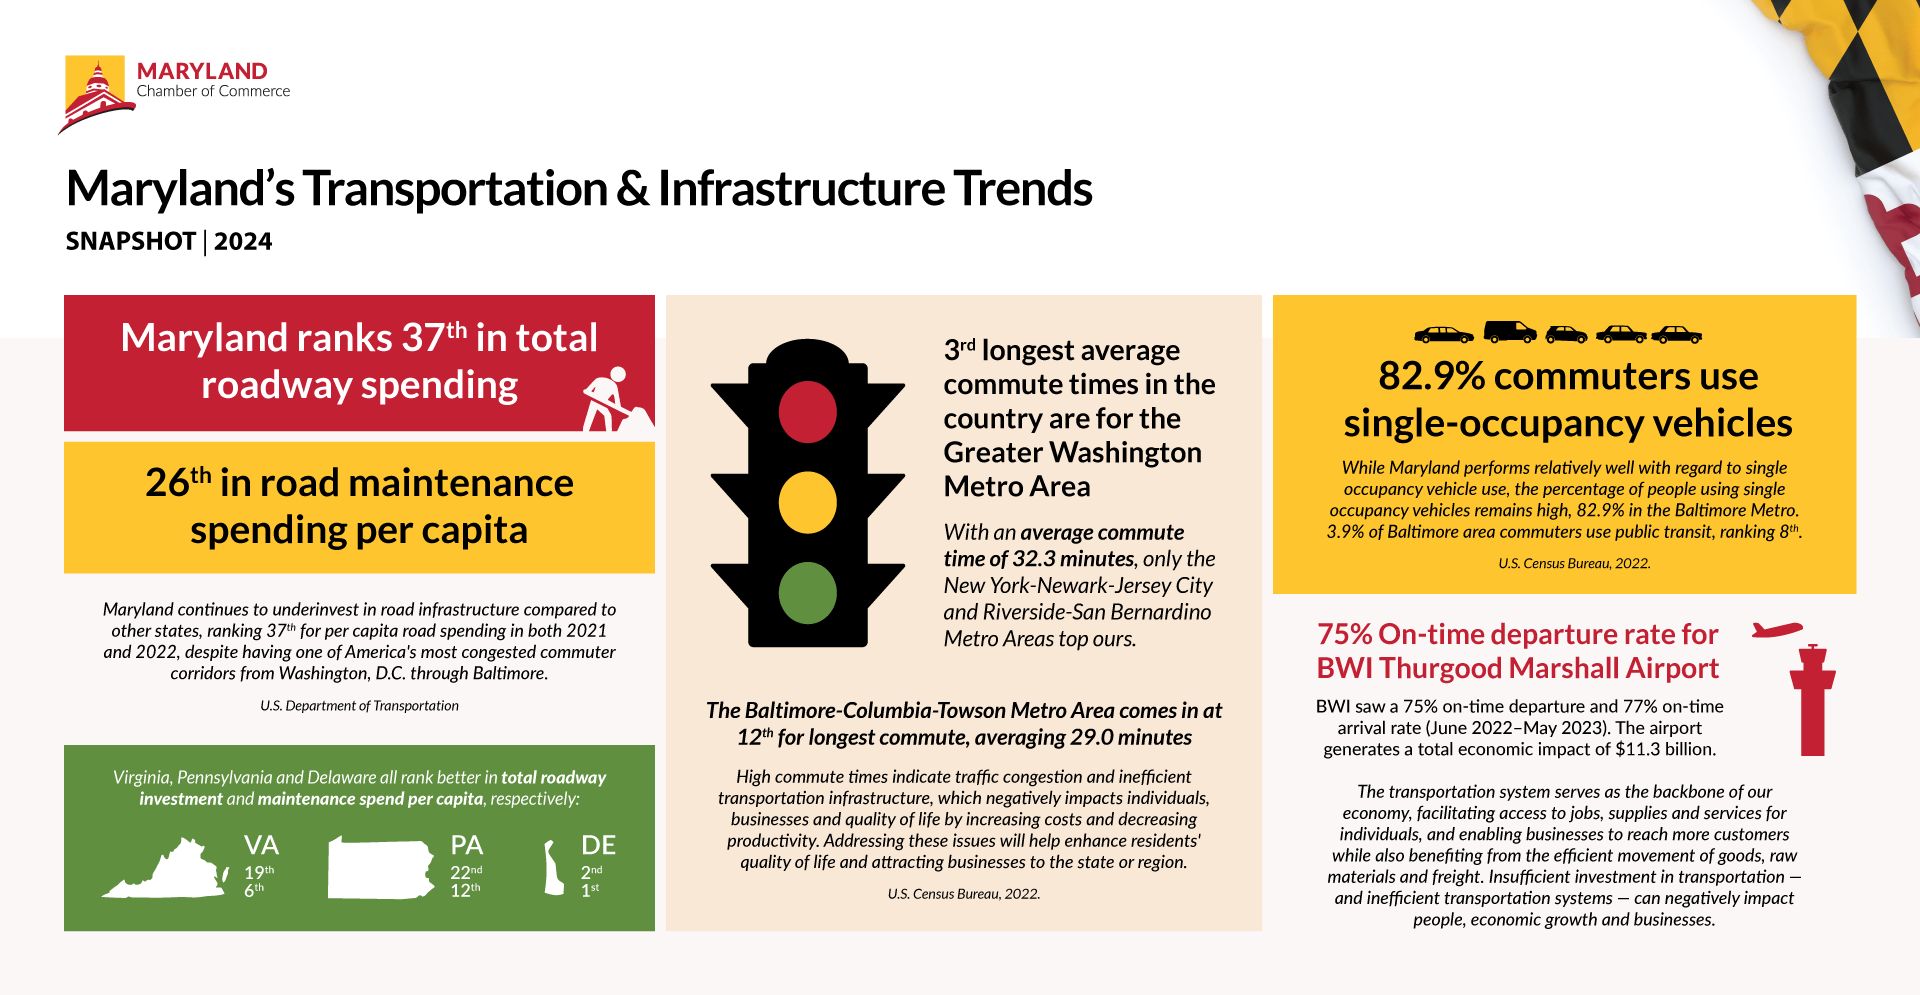
Maryland ranks as having low spending when it comes to state expenditures on roadways, particularly in the case of maintenance spending.
- The data: In 2021, Maryland spent $285 per capita in total on roadways. a rank of 37th. That same year, the state allocated $14 per capita for roadway maintenance, ranking 48th (only North Dakota has lower spending). In addition, the American Society of Civil Engineers reports that 48% of Maryland’s roads are in poor condition.
- Why it matters: A low state expenditure on roadways, both in total and capital per capita, along with low maintenance per capita, suggests that Maryland is not prioritizing its transportation infrastructure as highly as other states, leading to deteriorating road conditions, increased congestion, reduced safety, increased costs over time, and disadvantages for businesses and economic growth.
The information provided below is based on data from our 2023 Competitiveness Redbook. Please check back soon for an updated analysis of our 2024 data.
What the data is telling us:
Maryland’s energy prices are high, making it more expensive for businesses to operate and increasing the cost of living for residents.
- The data: Maryland ranks 40th for the average retail price per kilowatt hour (kWh) for industrial customers, 31st for residential customers, and 23rd for commercial customers, with prices higher than neighboring states. Interestingly, according to the U.S. Energy Information Administration, Maryland’s industrial sector consumed 7% of the energy used in Maryland, and the sector consumed the least amount of energy per capita among the states.
- Why it matters: Competitive energy costs are essential for attracting businesses and supporting a favorable business environment. Maryland’s high energy costs make it more expensive for businesses to operate and increase the cost of living for residents — and these issues factor into decisions to live, work, and/or operate a business in Maryland.
The information provided below is based on data from our 2023 Competitiveness Redbook. Please check back soon for an updated analysis of our 2024 data.
What the data is telling us:
Maryland has one of the lowest growth rates in the nation for GDP, signaling a sluggish economic recovery that is a concern for businesses.
- The data: In Maryland, the GDP data from 2021 shows that the state is ranked 15th in the nation for its GDP value, which is $438.235 billion. However, the state had a low GDP growth rate of only 6.7% from 2020 to 2021, ranking 49th for having one of the lowest growth rates in the country.
- Why it matters: Gross Domestic Product (GDP) measures the monetary value of all goods and services produced for sale in a state during a given period and can provide helpful insight into how strong and healthy our state’s economy is. The data shows that Maryland’s economy is growing at a slower pace than most other states, ranking 49th in growth rate, and implying weaker consumer demand, slower job creation, and limited opportunities for business expansion. This may lead businesses to reconsider investment and growth plans in our state.
The information provided below is based on data from our 2023 Competitiveness Redbook. Please check back soon for an updated analysis of our 2024 data.
What the data is telling us:
Maryland outpaces the region in manufacturing wages.
- The data: In Maryland, production workers in manufacturing make an average of $27.91, ranking the state 11th in the nation in this area.
- Why it matters: A robust manufacturing sector provides quality jobs that support families, drive economic growth and promote innovation. The data indicates that Maryland's manufacturing sector is relatively strong compared to neighboring states and the nation overall. Higher wages reflect a more skilled, productive workforce, as well as stronger labor demand — but the above-average wages come with a tradeoff - they can deter manufacturers from locating in Maryland vs. other states with lower labor costs and wages.
What the data is telling us:
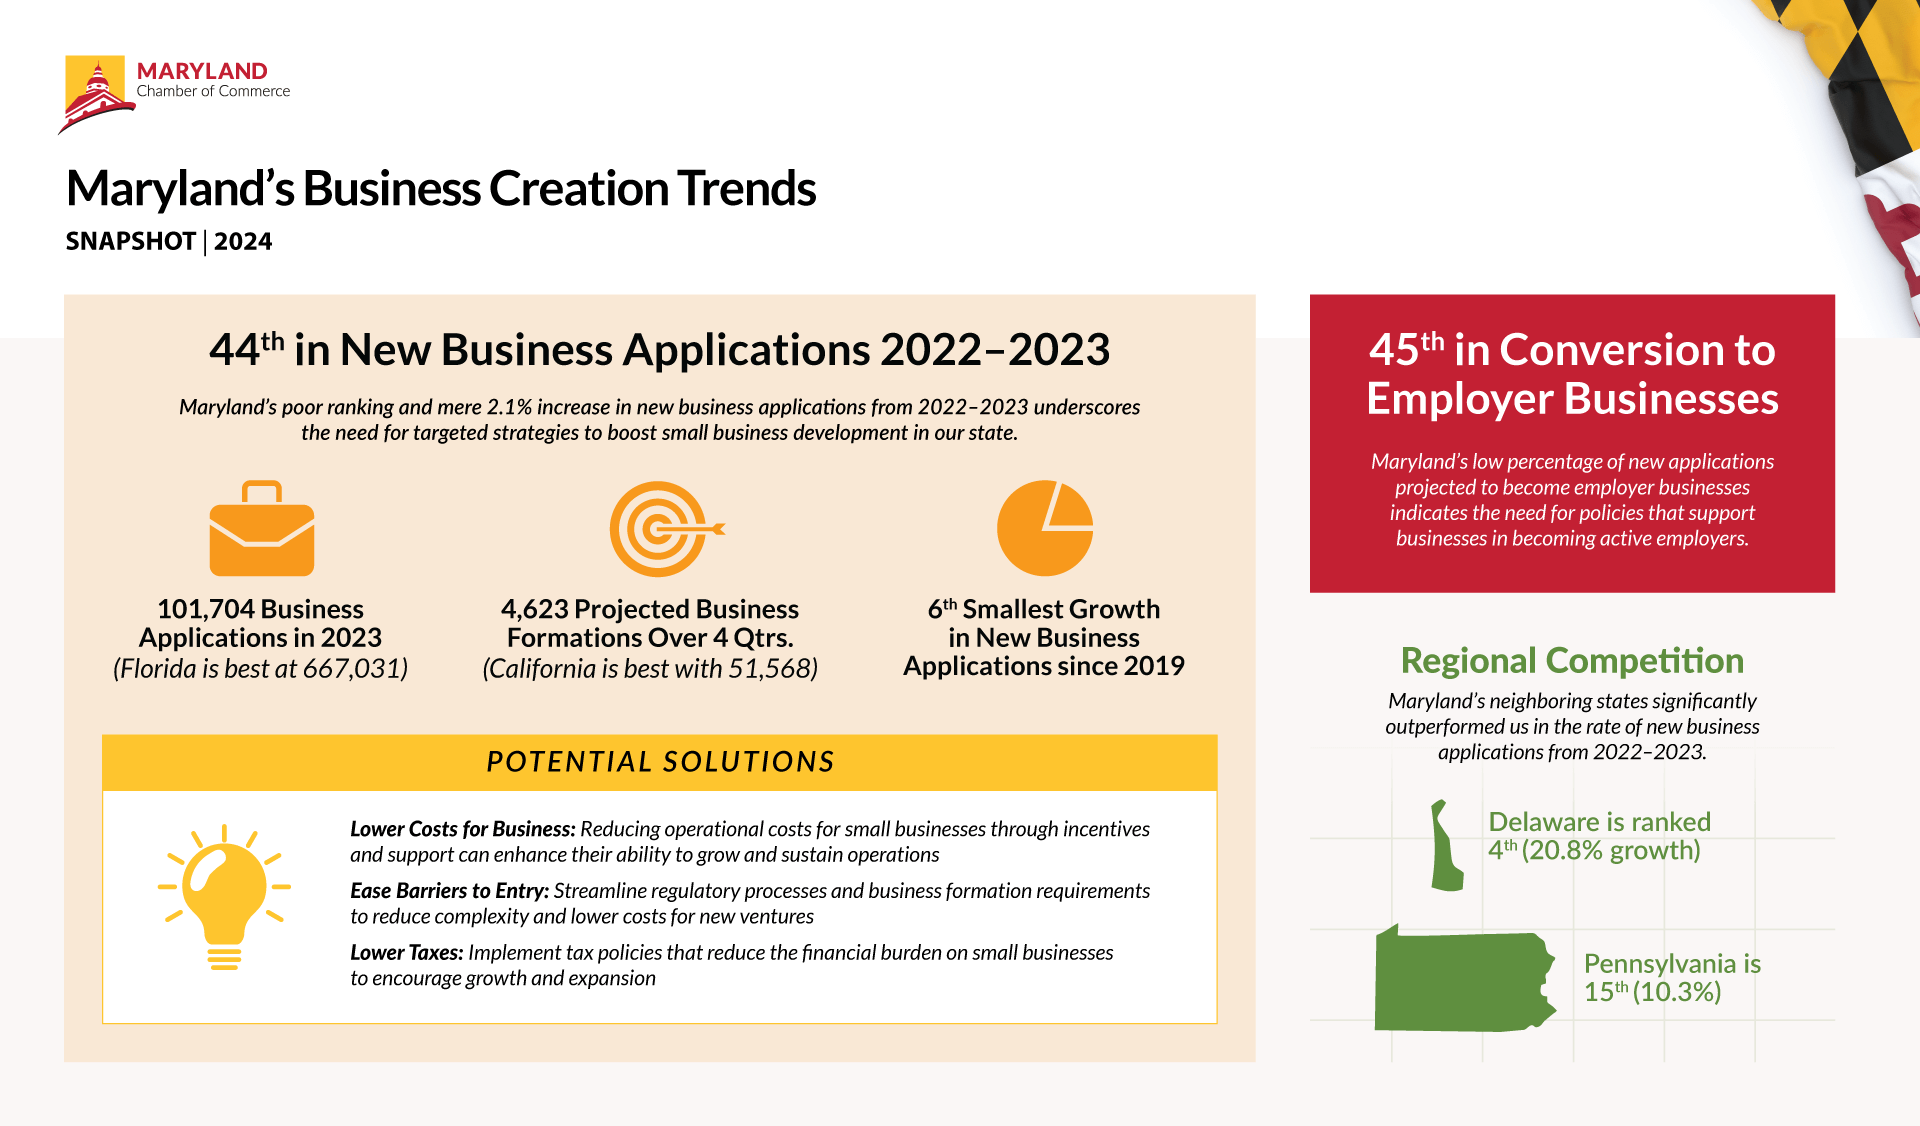
Maryland has a considerable number of high-tech business establishments but lags behind in business growth.
- The data: Maryland has 14,227 high tech business establishments with payroll; however the percentage of business establishment change is ranked as 43rd in the country.
- Why it matters: Maryland has a considerable number of high-tech business establishments, but its ranking of 43rd in terms of percentage change indicates a slower rate of growth compared to other states. This emphasizes the need for strategies to support and enhance the growth of the tech sector in Maryland to maintain competitiveness and attract further investments.
The 2024 Competitiveness Redbook for Maryland is sponsored by:
Presenting Sponsor
Touchstone Sponsor
Supporting Sponsors
Giant Food
Maryland Bankers Association
Maryland Tech Council
McCormick & Company
Salisbury Area Chamber of Commerce
W. L. Gore & Associates